Generar valor y desarrollar confianza: por qué los líderes son el secreto de la madurez analítica

Technology   |   Shane Remer   |   May 22, 2023 TIME TO READ: 7 MINS
TIME TO READ: 7 MINS

As 2023 ushered in new economic volatility and market uncertainty, many leaders are seeking ways to drive profitability and value.

The good news is they may not have to look any further than the mirror.

As we’ve talked about before, third-party research indicates that analytically mature organizations outperform others in their industry across nearly every metric, including 3-year revenue and 5-year operating income.
An image of an tablet with a maturity score assessment on it.

Now, thanks to the Alteryx Analytics Maturity Assessment, we’re seeing data that shows how leaders can increase maturity to drive that value.

The findings? It starts with leaders.
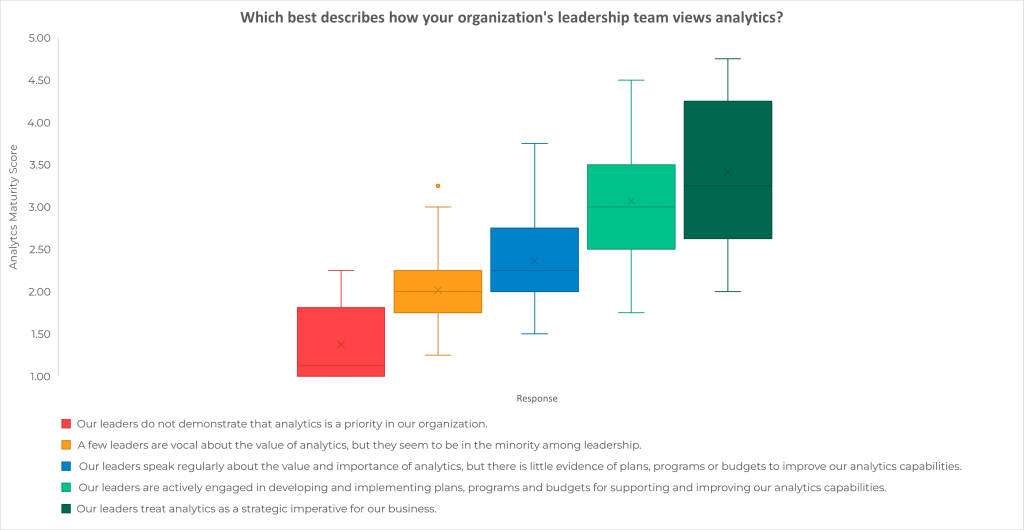
Image of a box and whisker plot chart. Chart title reads: “Which best describes how your organization’s leadership team views analytics? “The y-axis shows the analytics maturity score, with a range from 1 to 5. There are five response options showed. The first box and whisker plot shows the range of responses to the statement, “Our leaders do not demonstrate that analytics is a priority in our organization.” The approximate quartiles for this response, going from the bottom to top, are: 1 to 1. 1 to 1.2. 1.2 to 1.7. 1.7 to 2.4. The second box and whisker plot shows the range of responses to the statement, “A few leaders are vocal about the value of analytics, but they seem to be in the minority among leadership.” The approximate quartiles for this response, going from bottom to top, are: 1.25 to 1.75. 1.75 to 2. 2 to 2.25. 2.25 to 3.1. The third box and whisker plot shows the range of responses to the statement, “Our leaders speak regularly about the value and importance of analytics, but there is little evidence of plans, programs or budgets to improve our analytics capabilities.” The approximate quartiles for this response, going from bottom to top, are: 1.5 to 1.9. 1.9 to 2.3. 2.3 to 2.8. 2.8 to 3.75. The fourth box and whisker plot shows the range of responses to the statement, “Our leaders are actively engaged in developing and implementing plans, programs and budgets for supporting and improving our analytics capabilities.” The approximate quartiles, going from bottom to top, are: 1.75 to 2.5. 2.5 to 3. 3 to 3.5. 3.5 to 4.5. The fifth box and whisker plot shows the range of response to the statement, “Our leaders treat analytics as a strategic imperative for our business.” The approximate quartiles, going from bottom to top, are: 2 to 2.6. 2.6 to 3.2. 3.2 to 4.25. 4.25 to 4.75.

Analytically Minded Leaders Are Essential for Analytics Maturity 

Organizations with leaders actively engaged in developing analytics programs or setting analytics as a strategic imperative for business see higher analytics maturity scores.

As you can see from the box and whisker plot above, there’s a strong correlation between leaders prioritizing analytics and analytics maturity.

Unfortunately, it doesn’t appear many leaders are making analytics an imperative. Of the 216 respondents, only 22 percent of leaders are actively engaged in developing analytics plans and programs, and only 8 percent are actively engaged and treat analytics as a strategic imperative.

Worse, nearly half (47 percent) say that leaders are still discussing analytics’ importance without evidence of a plan or action.
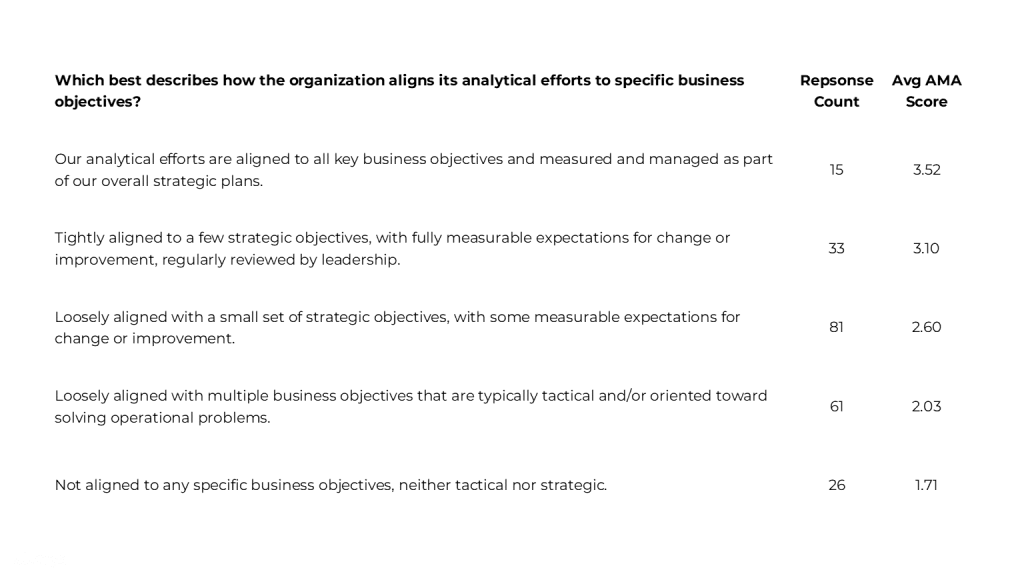
Image of survey responses with three columns and six rows. The first row contains column headers. The first column shows the responses to the question, “Which best describes how your organization’s leadership team views analytics?” The second column shows the response count. The third column shows the average AMA score for the response. The responses, response counts, and average AMA score for each are as follows. For the response, “Our leaders treat analytics as a strategic imperative for our business,” 17 responses with an average AMA score of 3.41. For the response, “Our leaders are actively engaged in developing and implementing plans, programs and budgets for supporting and improving our analytics capabilities,” 48 responses with an average AMA score of 3.07. For the response, “Our leaders speak regularly about the value and importance of analytics, but there is little evidence of plans, programs or budget to improve our analytics capabilities,” 102 responses with an average AMA score of 2.37. For the response, “A few leaders are vocal about the value of analytics, but they seem to be in the minority among leadership,” 31 responses with an average score of 2.02. For the response, “Our leaders do not demonstrate that analytics is a priority in our organization,” 18 responses with an average AMA score of 1.38.

As you can see from the chart above, the average analytics maturity score for organizations with leaders driving the change is nearly a point higher than those without plans. That extra point often places companies at stage 3, where organizations also start to see more value.

So, the question is, what should leaders do about it?

Accessing and Using Data Helps, But More Is Needed

The good news is that leaders have plenty of opportunities to shape the value they derive from initiatives.

The challenge is that they need to put plans into action.

In the past, it was simply enough to increase the ease of data access throughout a company. While that’s still one of the easiest ways to see a leap in analytics maturity and value, organizations need more to see increased maturity.
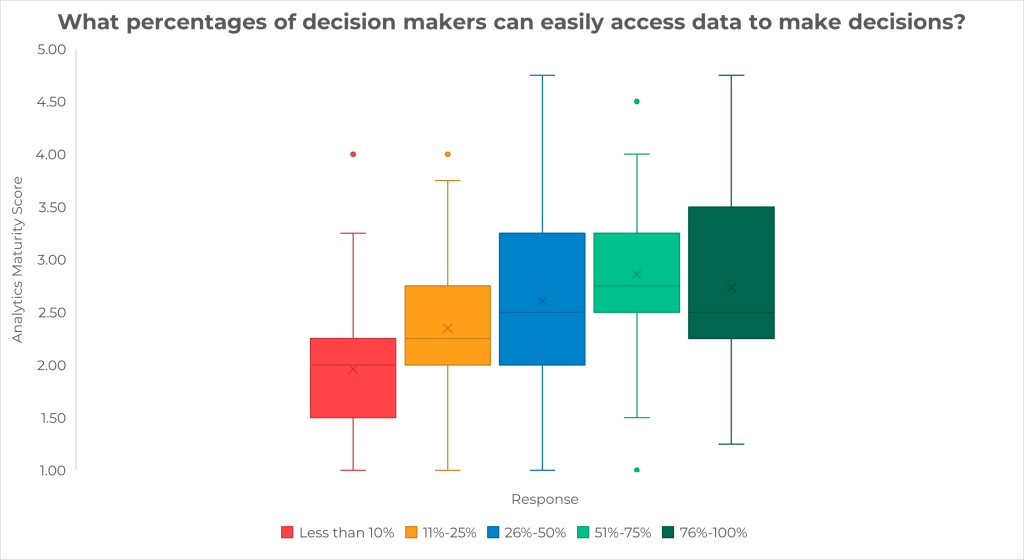
Image of a box and whisker plot chart. Chart title reads: “What percentage of decision makers can easily access data to make decisions?” The y-axis shows the analytics maturity score, with a range from 1 to 5. There are five response options showed. The first box and whisker plot shows the range of responses to the statement, “Less than 10%.” The approximate quartiles for this response, going from the bottom to top, are: 1 to 1.5. 1.5 to 2. 2 to 2.25. 2.25 to 3.25. The second box and whisker plot shows the range of responses to the statement, “11% to 25%”. The approximate quartiles for this response, going from bottom to top, are: 1 to 2. 2 to 2.25. 2.25 to 2.75. 2.75 to 3.75. The third box and whisker plot shows the range of responses to the statement, “26% to 50%” The approximate quartiles for this response, going from bottom to top, are: 1 to 2. 2 to 2.5. 2.5 to 3.25. 3.25 to 4.75. The fourth box and whisker plot shows the range of responses to the statement, “51% to 75%” The approximate quartiles, going from bottom to top, are: 1.5 to 2.5. 2.5 to 2.75. 2.75 to 3.25. 3.25 to 4. The fifth box and whisker plot shows the range of response to the statement, “76% to 100%” The approximate quartiles, going from bottom to top, are: 1.25 to 2.25. 2.25 to 2.5. 2.5 to 3.5. 3.5 to 4.75.

As you can see from the chart, increasing the percentage of decision-makers with easy access to data does increase analytics maturity. But those benefits wane as the percentage increases.

In fact, the average scores start to even out after the 26 to 50 percent range.
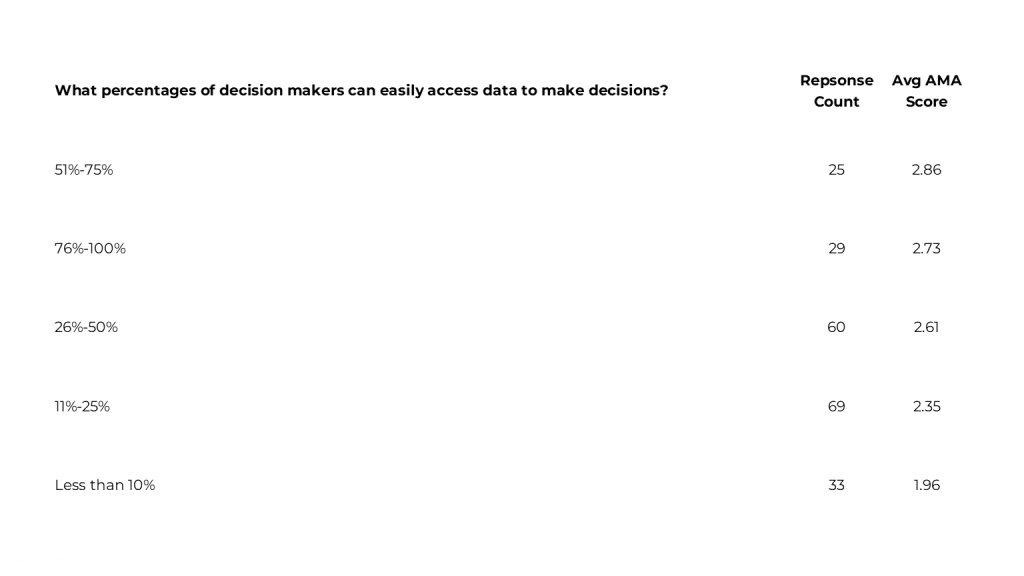
Image of survey responses with three columns and six rows. The first row contains column headers. The first column shows the responses to the question, “What percentage of decision makers can easily access data to make decisions?” The second column shows the response count. The third column shows the average AMA score for the response. The responses, response counts, and average AMA score for each are as follows. For the response, “76 to 100%,” 29 responses with an average AMA score of 2.73. For the response, “51% to 75%,” 25 responses with an average AMA score of 2.86. For the response, “26% to 50%,” 60 responses with an average AMA score of 2.61. For the response, “11% to 25%,” 69 responses with an average score of 2.35. For the response, “Less than 10%,” 33 responses with an average AMA score of 1.96.

Of course, having data is only one ingredient to driving value. As we all know, data only helps if you use it. So, you would expect that using data in decision-making would have just as strong of a correlation to analytics maturity. Yet, something surprising appears when we look at the data for analytics maturity compared to using data to make routing business decisions.
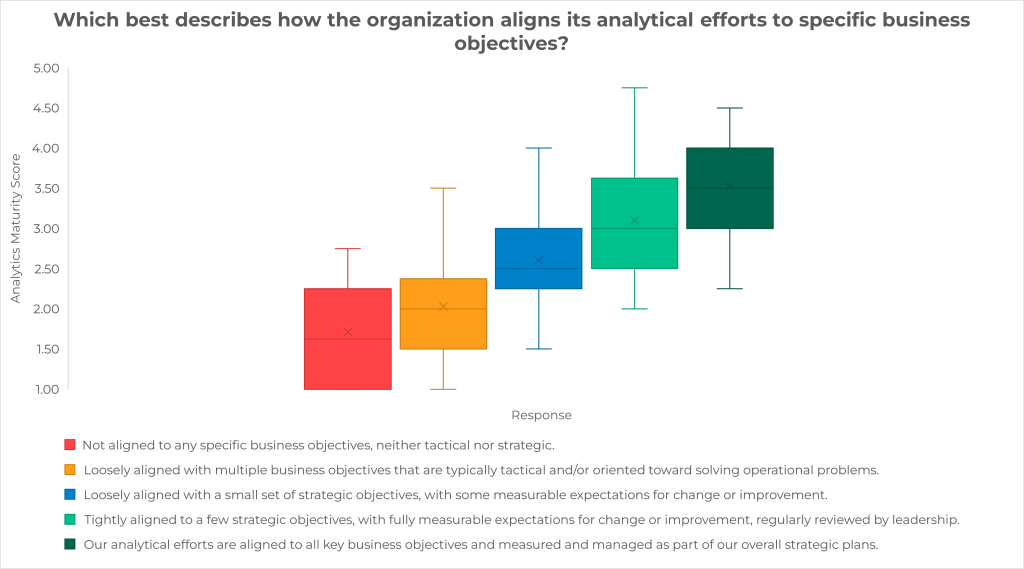
Image of a box and whisker plot chart. Chart title reads: “What percentage of the organization’s routine business decisions are appropriately framed and guided by data?” The y-axis shows the analytics maturity score, with a range from 1 to 5. There are five response options showed. The first box and whisker plot shows the range of responses to the statement, “Less than 10%.” The approximate quartiles for this response, going from the bottom to top, are: 1 to 1.4. 1.4 to 1.75. 1.75 to 2.1. 2.1 to 3.25. The second box and whisker plot shows the range of responses to the statement, “11% to 25%”. The approximate quartiles for this response, going from bottom to top, are: 1 to 2. 2 to 2.25. 2.25 to 2.75. 2.75 to 3.75.The third box and whisker plot shows the range of responses to the statement, “26% to 50%” The approximate quartiles for this response, going from bottom to top, are: 1 to 1.75. 1.75 to 2.5. 2.5 to 3. 3 to 4.75. The fourth box and whisker plot shows the range of responses to the statement, “51% to 75%” The approximate quartiles, going from bottom to top, are: 1.5 to 2.25. 2.25 to 2.75. 2.75 to 3.25. 3.25 to 4.5. The fifth box and whisker plot shows the range of response to the statement, “76% to 100%” The approximate quartiles, going from bottom to top, are: 1.25 to 2.25. 2.25 to 2.5. 2.5 to 3.25. 3.25 to 4.75.

Once again, we see a benefit to analytics maturity when organizations use data to appropriately frame and guide routine business decisions. There’s a significant lift to analytics maturity as companies use data to guide and frame more than 10 percent of their decisions.

However, the benefit of using analytics in decision-making starts to slow as it nears 25 percent, and there’s almost no increase in analytics maturity once a company passes 50%.

While increasing access to and the use of data and analytics does provide a lift to analytics maturity, it doesn’t provide as big of a lift as leaders who are driving change.

Organizations Can Drive Value Through Analytically Minded Leaders

As you saw from the first box and whisker plot, organizations with leaders that are actively driving plans or making analytics a strategic imperative are nearly a point ahead in analytics maturity compared to organizations that don’t.

However, that’s only one example of correlation. So, how about another?
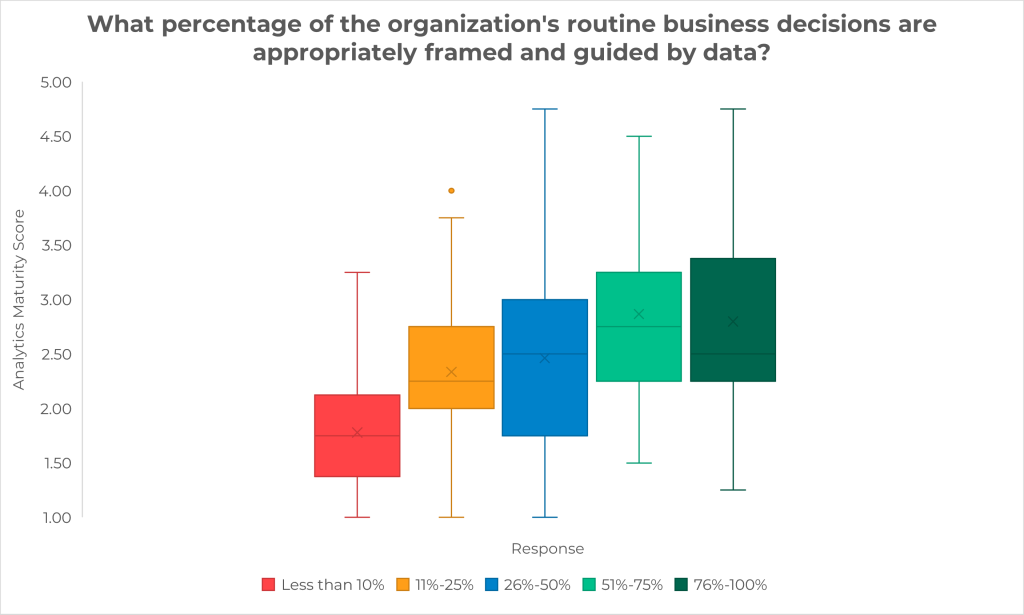
Image of a box and whisker plot chart. Chart title reads: “Which best describes how the organization aligns its analytical efforts to specific business objectives?” The y-axis shows the analytics maturity score, with a range from 1 to 5. There are five response options showed. The first box and whisker plot shows the range of responses to the statement, “Not aligned to any specific business objectives, neither tactical nor strategic.” The approximate quartiles for this response, going from the bottom to top, are: 1 to 1. 1 to 1.75. 1.75 to 2.25. 2.25 to 2.75. The second box and whisker plot shows the range of responses to the statement, “Loosely aligned with multiple business objectives that are typically tactical and/or oriented toward solving operational problems.” The approximate quartiles for this response, going from bottom to top, are: 1 to 1.5. 1.5 to 2. 2 to 2.25. 2.25 to 3.5. The third box and whisker plot shows the range of responses to the statement, “Loosely aligned with a small set of strategic objectives, with fully measurable expectation for change or improvement.” The approximate quartiles for this response, going from bottom to top, are: 1.5 to 2.25. 2.25 to 2.5. 2.5 to 3. 3 to 4. The fourth box and whisker plot shows the range of responses to the statement, “Tightly aligned to a few strategic objectives, with fully measurable expectations for change or improvement, regularly reviewed by leadership.” The approximate quartiles, going from bottom to top, are: 2 to 2.5. 2.5 to 3. 3 to 3.75. 3.75 to 4.75. The fifth box and whisker plot shows the range of response to the statement, “Our analytical efforts are aligned to all key business objectives and measured and managed as part of our overall strategic plans.” The approximate quartiles, going from bottom to top, are: 2.25 to 3. 3 to 3.5. 3.5 to 4. 4 to 4.5.

Do you see it?

There’s that correlation between analytics maturity and leaders again.

Organizations with leaders who align analytical efforts to all key business objectives, or even a few strategic objectives, see a more significant lift to analytics maturity than organizations that don’t. Once again, that gain is nearly a whole point in analytics maturity.
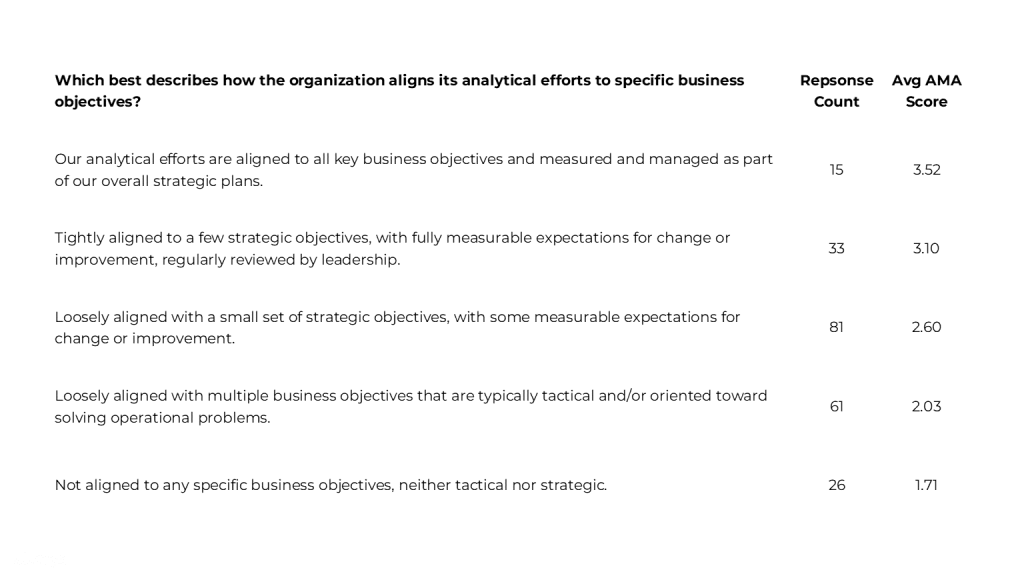
Image of survey responses with three columns and six rows. The first row contains column headers. The first column shows the responses to the question, “Which best describes how your organization aligns its analytical efforts to specific business objectives?” The second column shows the response count. The third column shows the average AMA score for the response. The responses, response counts, and average AMA score for each are as follows. For the response, “Our analytical efforts are aligned to all key business objectives and measured and managed as part of our overall strategic plans,” 15 responses with an average AMA score of 3.52. For the response, “Tightly aligned to a few strategic objectives, with fully measurable expectations for change or improvement, regularly reviewed by leadership,” 33 responses with an average AMA score of 3.10. For the response, “Loosely aligned with a small set of strategic objectives, with some measurable expectations for change or improvement,” 81 responses with an average AMA score of 2.60. For the response, “Loosely aligned with multiple business objectives that are typically tactical and/or oriented toward solving operational problems,” 61 responses with an average score of 2.03. For the response, “Not aligned to any specific business objectives, neither tactical nor strategic,” 26 responses with an average AMA score of 1.71.

While increasing access to data and using it to frame and guide business decisions helps with analytics maturity, they’re not the only factors contributing to increased value.

It’s not even the main factor. That correlation belongs to leaders.

Not just leaders but leaders who ensure that analytical efforts are aligned to all key business objectives and measured and managed as part of an organization’s overall strategic plans.

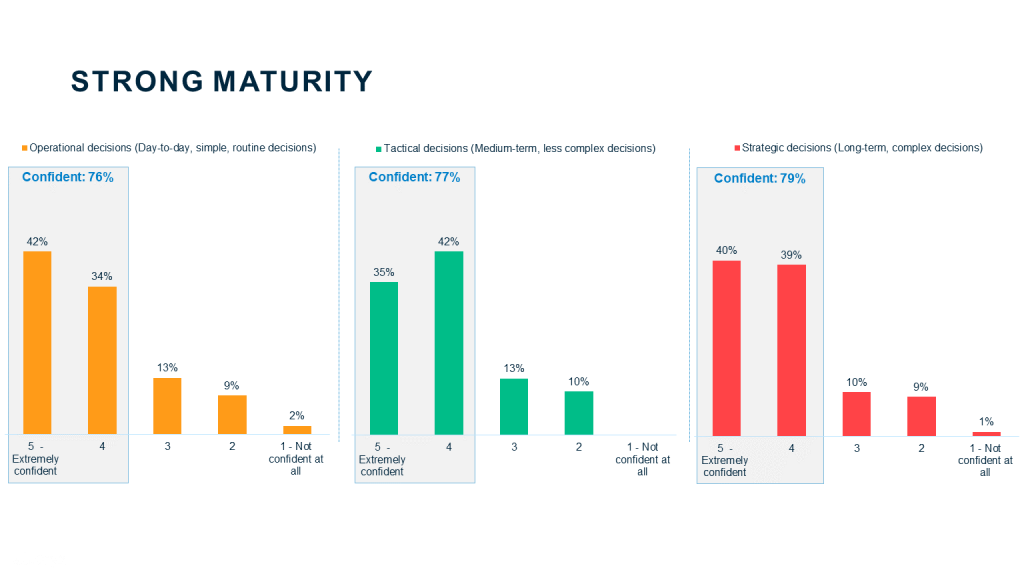
Furthermore, people at organizations with higher analytics maturity are more confident in their operational, tactical, and strategic decisions.
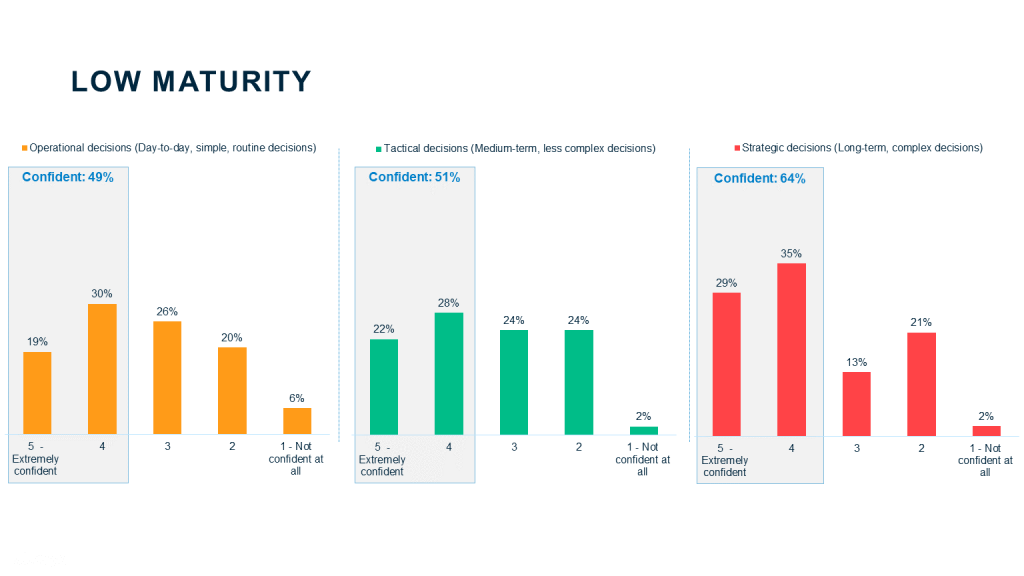
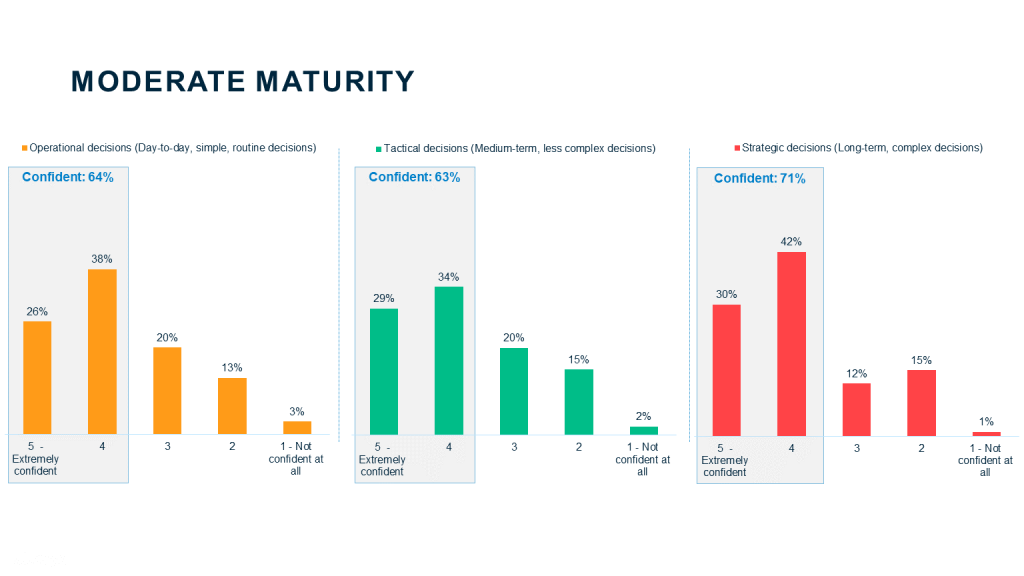
Image of three graphs with a title of Low Maturity. Each graph has a title and responses going from 5 (extremely confident) to 1 (Not confident at all). The first graph is titled: Operational decisions (day-to-day, simple, routine decisions.) The responses are: 19% are extremely confident, 30% are somewhat confident, 26% are neither confident nor not confident, 20% are somewhat not confident, and 6% are not confident at all. Combined, 49% of organizations with low maturity responded that they are confident in their operational decisions. The second graph is titled: Tactical decisions (medium-term, less complex decisions.) The responses are: 22% are extremely confident, 28% are somewhat confident, 24% are neither confident nor not confident, 24% are somewhat not confident, and 2% are not confident at all. Combined, 51% of organizations with low maturity responded that they are confident in their tactical decisions. The third graph is titled: Strategic decisions (Long-term, complex decisions.) The responses are: 29% are extremely confident, 35% are somewhat confident, 13% are neither confident nor not confident, 21% are somewhat not confident, and 2% are not confident at all. Combined, 64% of organizations with low maturity responded that they are confident in their strategic decisions.

Looking at these three graphs, you can see the confidence in operational decision-making climb from 49 percent at low maturity to 76 percent at strong maturity. The same improvements occur for tactical and strategic decision-making, with confidence percentages rising from 51 to 77 percent and 64 to 79 percent, respectively.

So, not only do leaders hold the keys to analytics maturity, but they also hold the keys to driving value and instilling confidence in short-, medium-, and long-term decision-making across their organizations.

Using Analytics to Drive Value

The data from the Alteryx Analytics Maturity Assessment for the second quarter of 2023 shows the clear connection between the emphasis leaders place on data and analytics maturity.

And, since higher analytics maturity leads to more operating income and revenue for organizations, leaders who align their analytics to business objectives should have a solid correlation to added value.

The question is, what should leaders do to increase their organization’s analytics maturity so they can see value?

We recommend taking at least the following four steps:

  1. Ensure decision-makers have easy access to data
  2. Use data to guide and frame routine business decisions
  3. Align analytical efforts to a few, if not all, business objectives
  4. Actively develop and implement plans for analytics initiatives and treat analytics as a strategic imperative

The first two steps require analytics investments that make it easy to move data around your organization and get answers from them. This includes decisions improved and enhanced with data science, machine learning, and AI.

The last two steps require strategic thinking, planning, and alignment.

Of course, we also recommend taking the Alteryx Analytics Maturity Assessment to get a clear picture of your current level of analytics maturity. After you take it, you’ll get a customized report with your score, how you compare to organizations within your industry, a list of next steps you can take, and recommended resources you can use.

If you’ve already taken the assessment, we have plenty of resources to help you plan, strategize, and align your organization.

No matter the path you take, though, remember that you’re in the driver’s seat. You don’t have to do anything radical to create value during economic volatility. You only need to look in the mirror and align your organization’s analytics to its objectives.

Tags