What is automated reporting?
Automated reporting uses analytics, business intelligence, and automation tools to simplify the different steps involved in creating reports and analyzing data, including automating the processes that transform raw data into factual observations or insights. By automating different stages of the reporting process, organizations can enhance overall productivity by spending more time on the insights themselves.
The automated reporting process sets itself apart from manual reporting in that automated reports are generated once, using specific criteria, metrics, and schedules, and can be duplicated or tailored to fit the entire organization’s needs. Meanwhile, generating manual reports requires teams to manually collect and input data, which becomes time-consuming and challenging when dealing with large amounts of data and is prone to human errors resulting from manual input or inconsistencies.
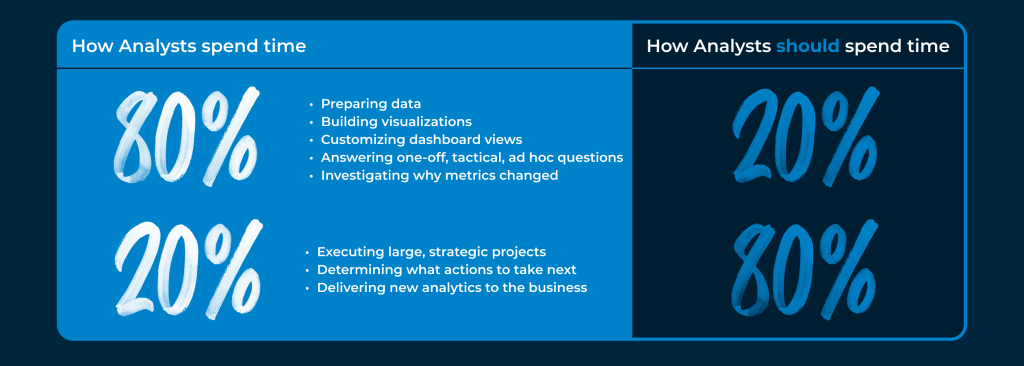
What are the benefits of report automation?
Automated reporting tools help fix common pain points in manual report building and empowers teams to produce deeper insights. Here are some of the benefits of automation:
- Reduces time, resource limitations, and manual intervention: Analyst-led insight generation can take organizations significant time investment and often requires collaboration between the analyst and the business stakeholder. Automation reduces the time it takes analysts to prepare and produce reports, which saves money and enables more reports to be created. PwC notes that “Across many key finance processes, automation and process improvement can reduce costs by 35%-46%.”
- Improved accuracy and consistency: Reporting automation helps improve data accuracy by reducing the number of manual edits needed to create reports. Reports can be created in a consistent format to facilitate comparisons across the organization.
- Better collaboration and accessibility: Manual report building is often done by data scientists and data experts; automation reduces the need for advanced coding skills, enabling non-technical users to create reports. This reduces a bottleneck that most organizations face – an over-reliance on specialized technical resources to meet basic reporting needs. This enables more stakeholders to contribute to reporting, which allows for more information sharing and data-driven decisions.
- Dynamic detection and faster insights: In addition to manual alerts and anomaly detection, automated reporting tools can identify and offer dynamic, real-time recommendations as data is updated. These capabilities improve efficiency and enable faster decision-making, as when data is refreshed, insights are refreshed.
As the potential cost of overlooking crucial insights can be significant, automated reporting is more than just a convenience, as it offers a vital resource to businesses. Automation empowers organizations to harness the full potential of their data and unlock new insights.
Best practices of automated reporting tools and dashboards
Automated reporting aims to improve the accuracy and speed of insight generation and empower more users to adopt reports. The key considerations of how to get started are listed below:
- Define goals: Define what business challenges these reports will aim to resolve, insights that will be produced, KPIs, and clear roles and responsibilities for stakeholders that should be involved.
- Ensure data quality: Use data preparation and validation procedures to ensure data accuracy and consistency and test against bias.
- Establish security and governance: Create procedures for handling sensitive information, adhering to compliance regulations and access controls. Implement processes to audit, monitor, and enforce compliance.
- Leverage domain expertise: Include all relevant stakeholders and specialists in report creation to ensure the correct data sources are used, and data is interpreted in the right context.
- Provide consistent designs: Create templates and guidelines on how to use visual elements, along with data and written summaries to help users quickly locate and interpret key insights.
- Provide training: Empower stakeholders with training for data analysis, understanding KPIs, and functionality of automated reporting tools to increase productivity, efficiency, and overall adoption of reports.
- Balance AI and ML: Incorporate AI and ML into every step of report creation to maximize the full potential of automation and insight generation.
- Maintain human involvement: Establish review processes and request feedback from stakeholders, domain experts, and end-users to ensure quality assurance, relevance, and possible improvements or customizations.
Tools that enable full automation
Traditional reporting typically involves manual edits, technical coding skills, or separate platforms in the following areas:
- Data preparation: Manual use of Excel or coding skills in SQL or ETL tools
- Report creation: Manual edits in Excel or separate reporting platforms in Tableau, Power BI, Qlik, or Looker
- Insight generation: Coding skills in SAS, R, Python, or SPSS for statistical analysis
Alteryx empowers organizations to automate reporting by removing coding requirements, resulting in time savings, increased efficiency, enhanced scalability, and broader accessibility to users. Alteryx provides a complete solution to streamline the reporting process, ensuring ease of use and efficiency for all users.
The data preparation stage of report creation can be completed through Alteryx Designer, along with AiDIN, leveraging both automation and AI. Alteryx Auto Insights can be used for both report creation and insight generation throughout the report-building process.
Within the Auto Insights reporting framework is an embedded intelligence layer that provides advanced data analysis capabilities that can identify trends, patterns, and stories in the data as both data and business conditions evolve. The resulting reports and dashboards become dynamic as the reports provide automatic insights and suggestions.
In essence, data takes the lead, guiding focus and evolving alongside shifting business dynamics. Auto Insights can detect shifts in patterns, trends, and drivers over time, which standard dashboards cannot readily illustrate.
How to create automated reports with Alteryx Auto Insights
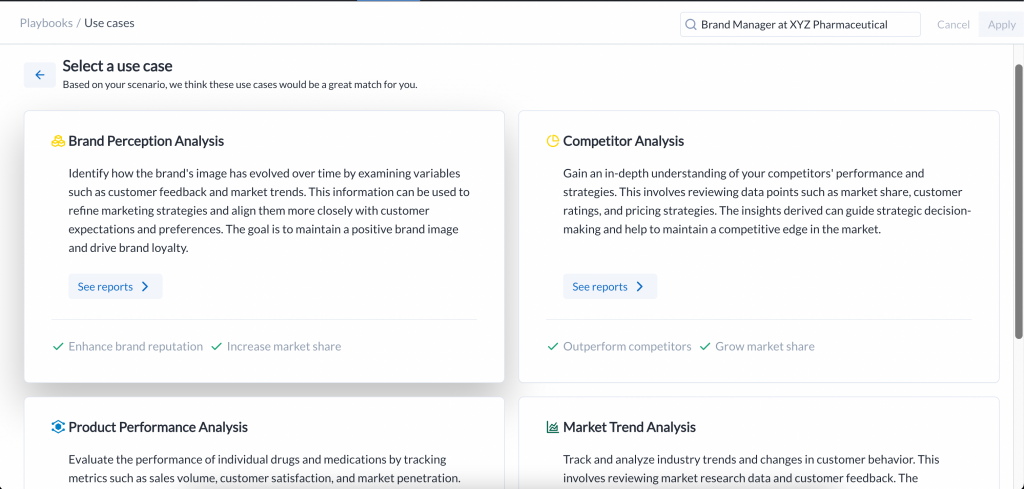
- Define your objective and requirements. Successful reporting initiatives require two key elements to achieve results: establishing business requirements and data requirements. Question(s) need to be defined to be answered, and data requirements need to be fulfilled. Auto Insights automates this process with Playbooks, a prompt-based experience that recommends use cases, builds prototypes, and defines data requirements quickly. The user simply enters their role, industry, or company, and Playbooks automates the first step in the reporting process.
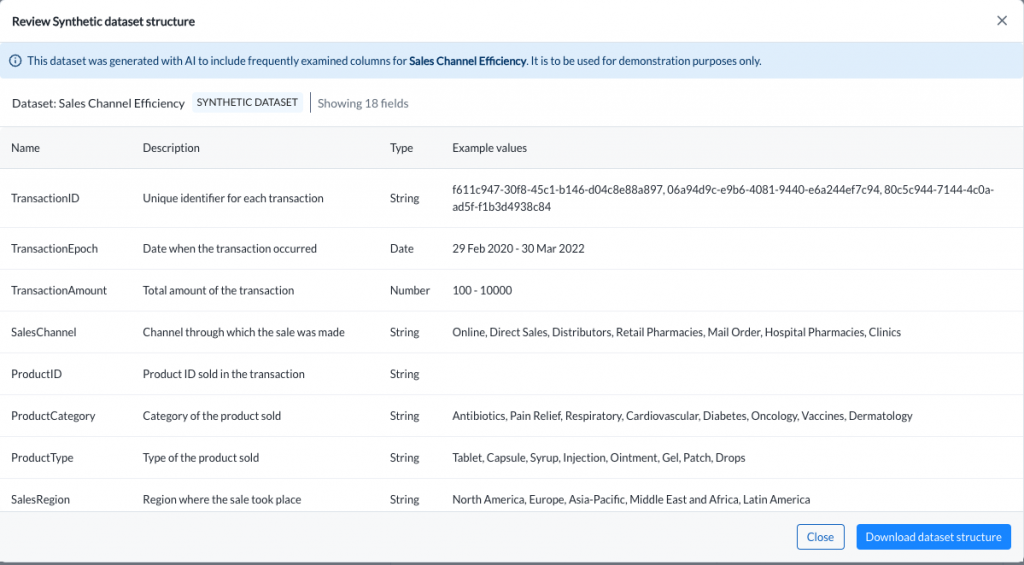
- Prepare your data. Playbooks has provided a target data structure to aim for, and with data requirements in hand from Playbooks, the next step is to use a data prep and blend tool like Alteryx Designer to turn a dataset from a source system (e.g. Salesforce CRM, Workday, etc.) into a usable dataset for reporting.
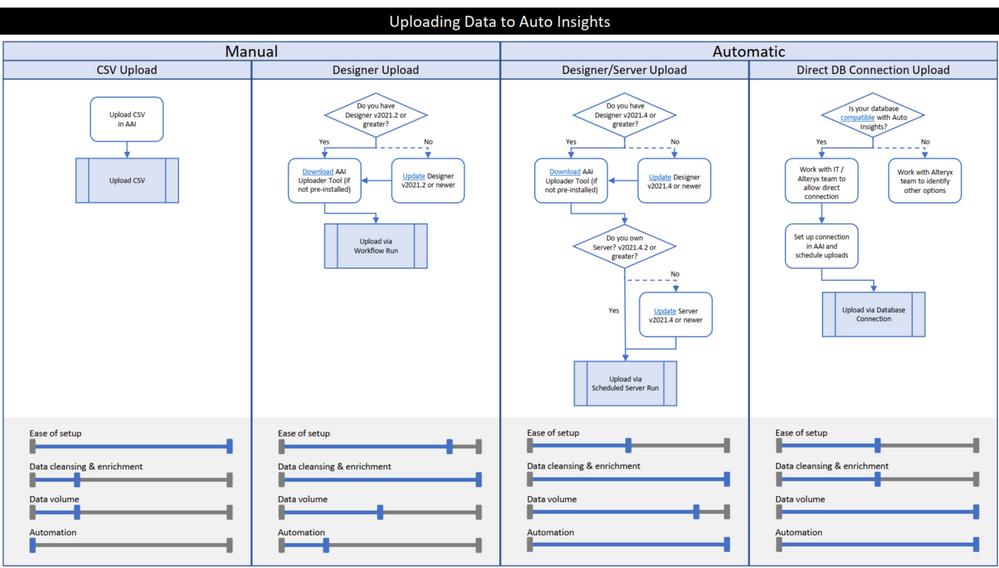
- Connect your data. Once the dataset is ready to go, it can be loaded into Auto Insights via a variety of methods – directly as a CSV, through a direct integration in Alteryx Designer, or it can be loaded into a data warehouse and accessed directly from the data warehouse in Auto Insights.
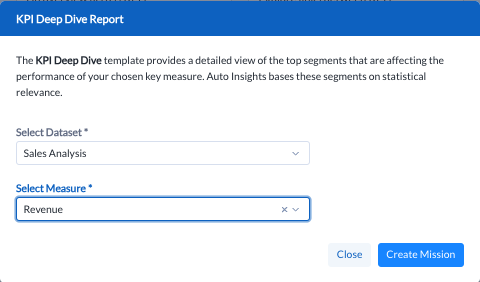
- Draft reports from templates. Once the dataset is loaded, the user can either recreate the prototype from Playbooks with a few clicks, or they can opt to create a KPI Summary using a Mission Template. Either path is straightforward and simply requires some configuration to set up.
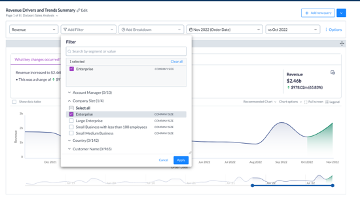
- Customize the report. With the draft Mission report in hand, the user can customize the report by adding additional pages that analyze different metrics, or they can create different views of the same metric – adding filters, breakdowns, or changing the type of visualization that accompanies the story that Auto Insights detects and explains.
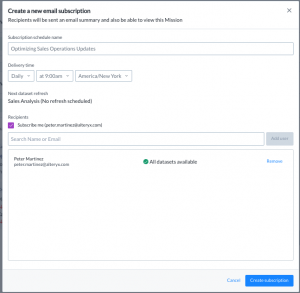
- Share. The report can be shared with decision-makers or key stakeholders via e-mail, or they can interact with the report directly in Auto Insights. With Magic Missions, the report can be translated from an interactive report in Auto Insights into a PowerPoint or e-mail summary document, depending on the audience.
Auto Insights use cases
CX (customer experience) and marketing reporting
In competitive markets, optimal customer experience can be a major differentiator. To excel in this area, customer-facing leaders such as marketing, sales, and customer service need to have a deep understanding of the customer lifecycle and buyer journey. They also need to be aware of the factors that impact customer churn at any given point. This requires having real-time insights and metrics about customers and CX-related data, rather than relying on static weekly, monthly, or quarterly reports.
Auto Insights serves as an AI-powered analytics assistant that identifies and presents the most significant patterns in CX and customer data. It provides valuable information on what factors drive customer acquisition, retention, and service quality.
Automated financial reporting
Auto Insights addresses the challenge of generating insights by quickly detecting meaningful patterns in financial data and explaining the driving factors behind key performance indicators. This enables finance teams to make informed decisions efficiently and at scale, even without advanced data expertise, as it streamlines the process of creating data stories that are easy to understand and act upon for stakeholders across various departments.
Root cause analysis (RCA)
Root cause analysis helps teams determine the root cause of issues to better identify solutions. Auto Insights uses purpose-built algorithms to analyze data within seconds to provide insights on what caused the changes in your metrics over time.
Get started with Alteryx Auto Insights
Alteryx Auto Insights helps organizations bring to light crucial information, explaining it in clear language. By enabling automation, Auto Insights simplifies the business intelligence development process by reducing reliance on manual feedback and edits needed from data and domain experts. Auto Insights surfaces patterns, stories, and trends, empowering teams to understand the “why” behind their data.
To get started today, try the Auto Insights Simulation, an AI-enhanced, free, personalized demo. The Simulation allows you to explore use cases and interact with sample reports in real-time. You can provide your role, company, industry, or business objective, and the demo will provide relevant use cases and sample reports built on a synthetic dataset.