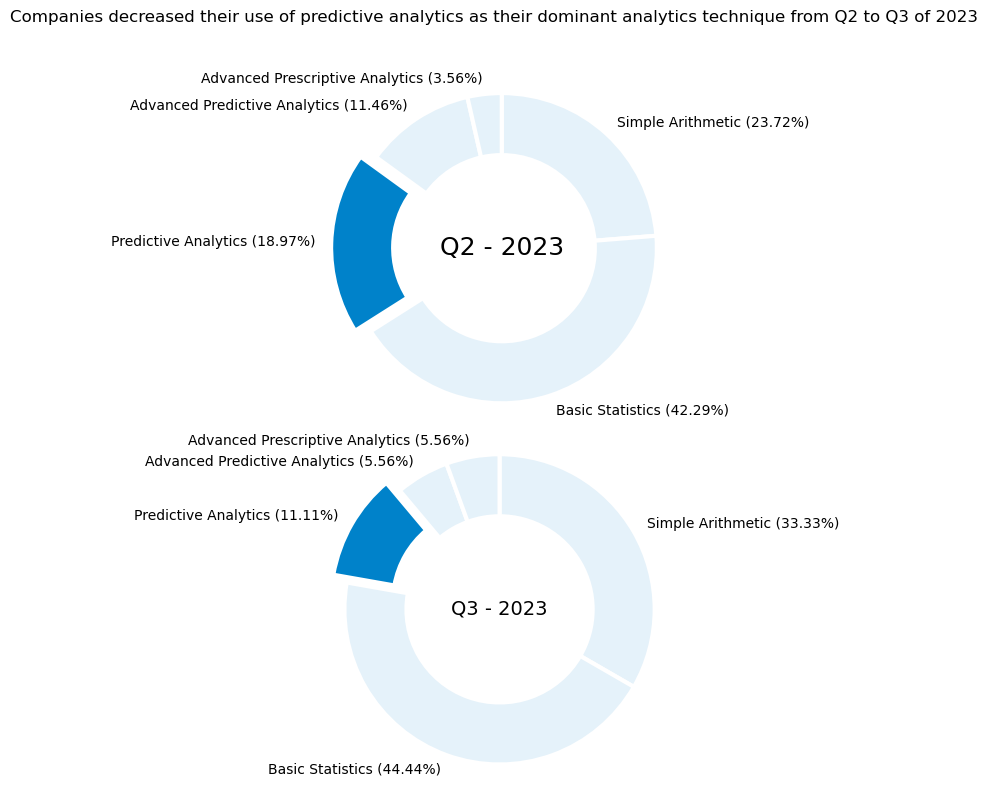
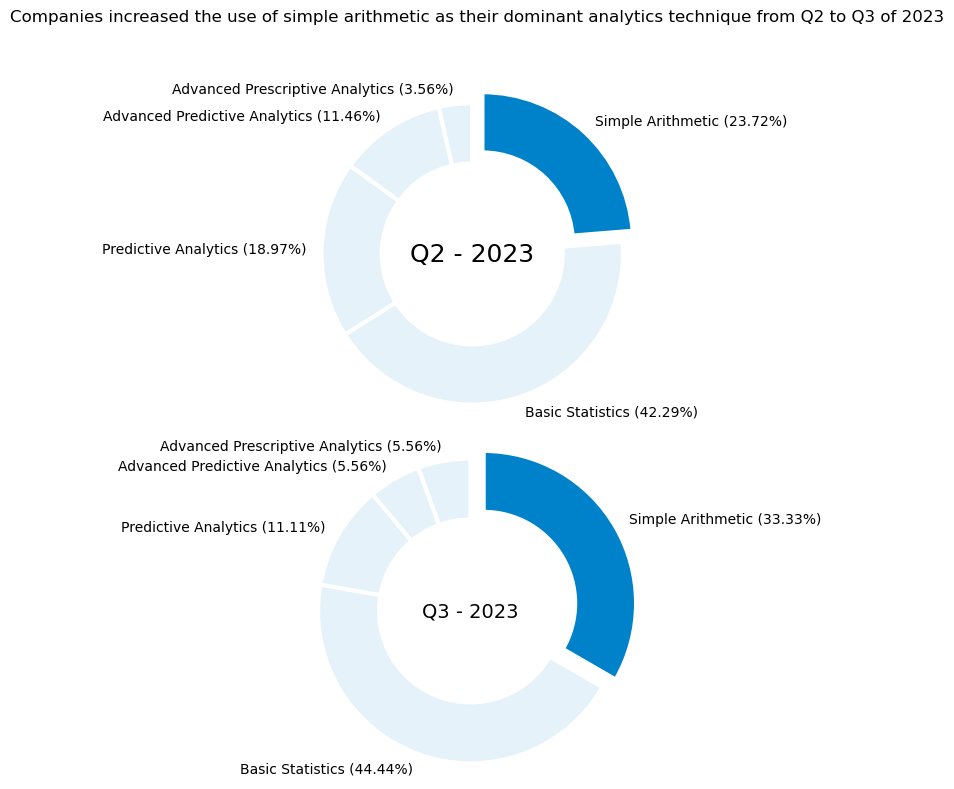
According to our Analytics Maturity Assessment data, from the second quarter of 2023 through August 17 of 2023, the percentage of people who reported using predictive analytics as their dominant analytical technique dropped from 19 to 11 percent.
Meanwhile, the percentage of people who reported using advanced prescriptive analytics as their dominant analytical technique climbed from 3.6 percent to 5.6 percent, representing 56 percent growth.

So, what does this mean?
It’s hard to say with certainty, but we have a few theories.
Theory 1: Fears of recession and interest hikes forced a reduction in analytics spending.
There’s no question that speculations of a recession mixed with the Fed hiking interest rates forced companies to turn a critical eye to their budgets. Whether or not those same economic pressures led to cuts in spending for analytic initiatives, we don’t know.
We can say that there was a 46 percent spike in the percentage of recent assessment takers who reported using simple arithmetic functions as their dominant analytical technique than the previous quarter. We also see a slight uptick in the use of basic statistics.

Even so, a decrease in analytics funding might not explain the decrease in the most-used technique of predictive analytics. Companies could still be investing the same amount in analytics initiatives (or increasing them) but choosing to use different methods.
Which brings us to our second theory.
Theory 2: Companies aren’t seeing the value they expect from their investments.
Recent economic conditions have put pressure on companies to produce value, and that pressure is being passed onto the employees. But as many companies froze spending or scrutinized potential deals, it became harder for companies and their employees to do that.
The increased use of advanced prescriptive analytics and simple arithmetic and basic statistics could reflect the declining revenue and increased pressure to create value that companies are seeing.
Put another way, people are under pressure, and they don’t have time to wait for analytics. They need to make decisions fast or risk losing opportunities.
Meanwhile, many companies are missing the mark on their revenue goals (even if their revenue is increasing), and they may be attributing the lack of value creation to their analytics investments.
When people are pressured to produce, they’re more inclined to fall back on experience and gut decisions, especially when they don’t have time to learn new data skills or interpret insights.
(If true, this explanation highlights a crucial reason for companies to increase data literacy in their organizations.)
However, the shift in dominant analytical techniques and the lack of value from analytics investments could be explained by another problem.
Theory 3: Companies aren’t investing in analytics software that everyone in their company can use to meet corporate goals.
In the same way buying a greenhouse and planning to grow your produce won’t guarantee that you save money on groceries, simply introducing advanced analytics into a business doesn’t guarantee that companies will see value from them.
When employees are given new analytics tools and platforms, they expect those tools and platforms to make their lives easier and help improve their performance. If a sales manager is told a platform will help them understand the root causes behind lost deals, but that same manager can’t use the analytics software to get those answers, they’ll see that investment as falling short of expectations.
If those same tools and platforms are slow, hard to use, or require steep learning curves, then people will ignore them and use what they know instead.
After all, people are under a lot of pressure, and they need to produce results.
So, it could be that companies who invested in analytics the past few quarters invested in platforms that weren’t user-friendly and intuitive.
This problem might not be their fault. Selecting the best platform is a complicated endeavor that requires understanding how everyone in a company uses data and what they need to do their job.
(It’s for those reasons we made a cloud analytics buyer’s guide that explains what each person needs from an analytics platform and simplifies the process of selecting one.)

After all, why would anyone continue using predictive analytics if the solution that delivered them was complicated and slow?
Conclusion
When you mix all the theories mentioned above — complicated solutions, a lack of value, and scaled-back budgets — you get a storm perfect for a shift in the preferred analytical technique companies are using.
Of course, these theories are all just that — theories.
The data we used for this article comes from the Alteryx Analytics Maturity Assessment, and it’s important to note that different people take the assessment each month. Though, many retake it to assess their progress in becoming analytically mature.
It’s just as possible that companies are increasing spending on analytics as it is that they aren’t. It’s also just as possible that companies are using one analytical method more than another or that they’re all using them the same amount as before. And it’s also possible that the only thing that’s changed from the last quarter to this quarter is the people taking the assessment.
This explanation is just how we’re interpreting the data based on our experience and knowledge in the analytics world.
We’ve seen it before, and we may be seeing it again.